On-site Web Server That Can Be Accessed from Any Terminal Incorporating a Browser
A high-performance trend graph display screen is incorporated as a standard function.
Trend screen
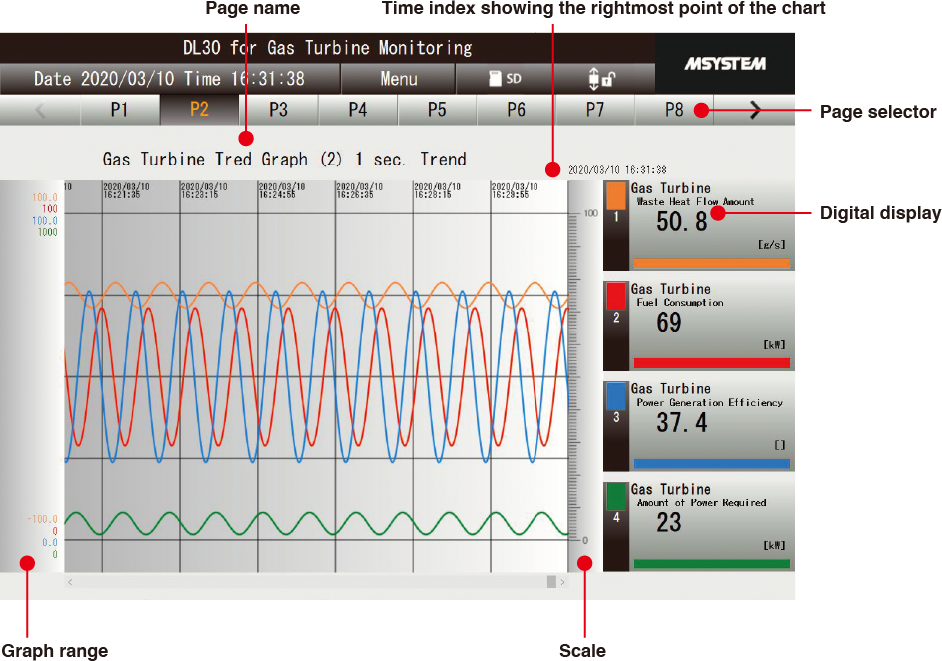
The DL30-G displays 16 trend screen pages with 4 pens per page (64 pens in total).
All types of I/O channels (Ai/Di/Pi/MA/MD/Ao/Do/Do groups) are assigned to each pen (duplicate registration is possible).
The sampling speed can be specified in 1, 5, 10, or 30 seconds, 1, 5, 10, 15, or 30 minutes, 1 hour, or 1 day in page units.
The maximum number of samples is 50,000, and if it exceeds that, it will be overwritten automatically.
The display is automatically updated*1.
*1. The display update cycle is 0 to 999 seconds, and if it is set to 0 seconds, the display will not be updated.
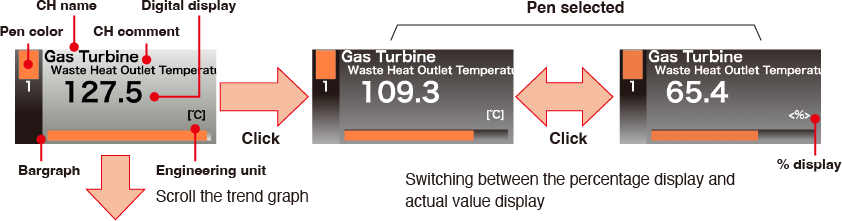
Digital Display
Useful Features of Trend screen
-
Changing the maximum and minimum values of the scale
You can change the maximum and minimum values of the scale.
You can expand the display range to see the trends, such as when a signal is input on an unexpected scale during measurement. -
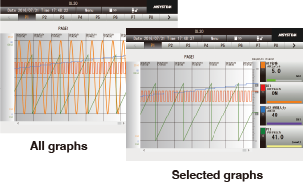
Showing/Hiding the pen
You can make the trend graph easier to see by leaving only the signals you want to monitor and hiding the others.
-
Expanding/Shrinking the time axis
You can check the transition of the graph at a glance by shortening the time of the trend graph measured for a long time.
The time axis can be switched in four steps: 100% (equal magnification), 50%, 20%, and 10%.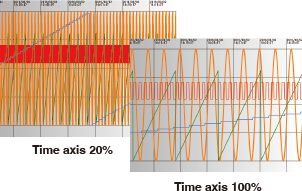
-
Comparing graphs
(moving in the direction of the scale)You can move the trend graph of the selected pen in the direction of the scale.
This is useful when you want to quickly find the difference between 2 graphs that change in the same way.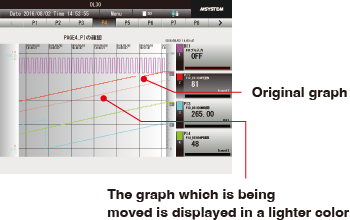
-
Comparing graphs (scaling)
You can enlarge the trend graph of the selected pen in the direction of the scale.
You can enlarge and observe slight changes in the trend graph.
-
Changing the update cycle of the display screen
You can change the display update cycle.
The display update cycle can range from 0 to 999 seconds.
If you set it to 0 seconds, the screen will not be updated automatically.
Make settings according to the signal to be measured. -
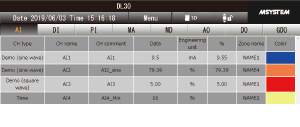
Data screen
-
Event screen
The current values of the assigned channels are listed.
Displayed items differ depending on the channel type (as in I/O types such as Ai, Di, and Ao). The display is automatically updated*1.
*1. The display update cycle is 0 to 999 seconds, and if it is set to 0 seconds, the display will not be updated.
The screen displays up to 2,000 event data items (i.e., event log, system log, communication port data) stored in the internal memory chronologically. You can switch the display of all events, the current day’s events, and the previous day’s events. The display is automatically updated*1.
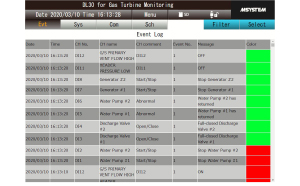
*1. The display update cycle is 0 to 999 seconds, and if it is set to 0 seconds, the display will not be updated.
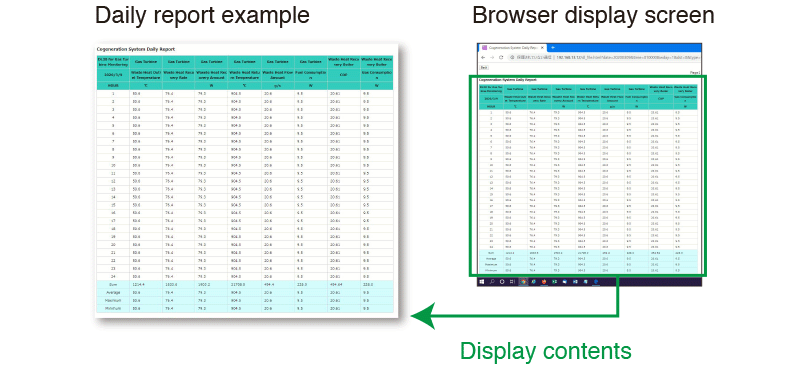
The created report can be monitored from the browser.
Report screen
The DL30-G displays saved report data (daily, monthly, and annual) in the internal memory in tabular format. One table displays eight-channel data, and the following tables display ninth-channel data and later.
This is convenient, and you can transfer the report automatically.
You can attach the report to an email and send it automatically.
You can use the email report function to send a report file saved on an SD card by email. You can set the transmission timing of the report to the time of file updating and the transmission timing of logging data and log data to the time of filing.
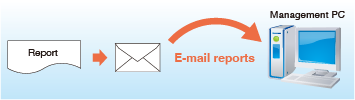
Mail Reporting (clink for more information)
Automatically sent from the FTP client.
You can use the FTP client environment to send a report file saved on an SD card to the FTP server. The timing of transmission occurs when the file is updated.
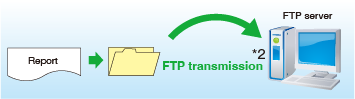
*2. FTPS supported.
Communications Control (clink for more information)
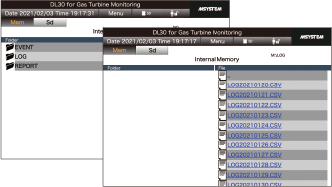
Download screen
A list of logging data, report data, and event data stored in the internal memory or SD card is displayed.
A list of folders and a list of files are displayed on the left-hand side and the right-hand side, respectively. You can download the data in the internal memory and files on the SD card. You can also manually delete old files in the SD card.
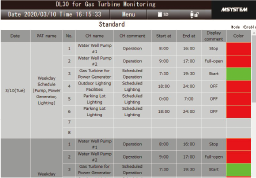
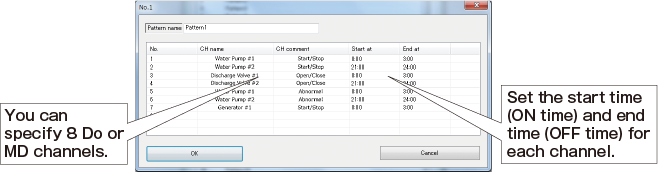
Schedule screen
You can check the current status of channels operating according to the schedule registered in advance. You can specify up to 8 channels of digital output (Do) values and digital function register (MD) value in a single schedule, and set the start time of ON output and the end time of OFF output for each. You can register up to 64 schedule patterns per day. The registered pattern will be allocated from the current day to one week ahead. For example, you can use 7 patterns to set different schedules for each day of the week or use 2 patterns to allocate a weekday schedule from Monday to Friday and holiday schedule on Saturday and Sunday.
Features of Schedule Function
- You can edit start/end time settings, register devices, and perform various types of maintenance on the web screen.
- Using the group digital output (GDo) channel function*3, you can operate digital output (Do) values and digital function register (MD) value collectively.
- With external contact input, you can use the schedule function to turn all outputs OFF at once.
- You can register a special day pattern by specifying the year, month, and day.
*3. The group digital output (GDo) channel function can handle digital output channels (Do and MD) as a grouped virtual channel.
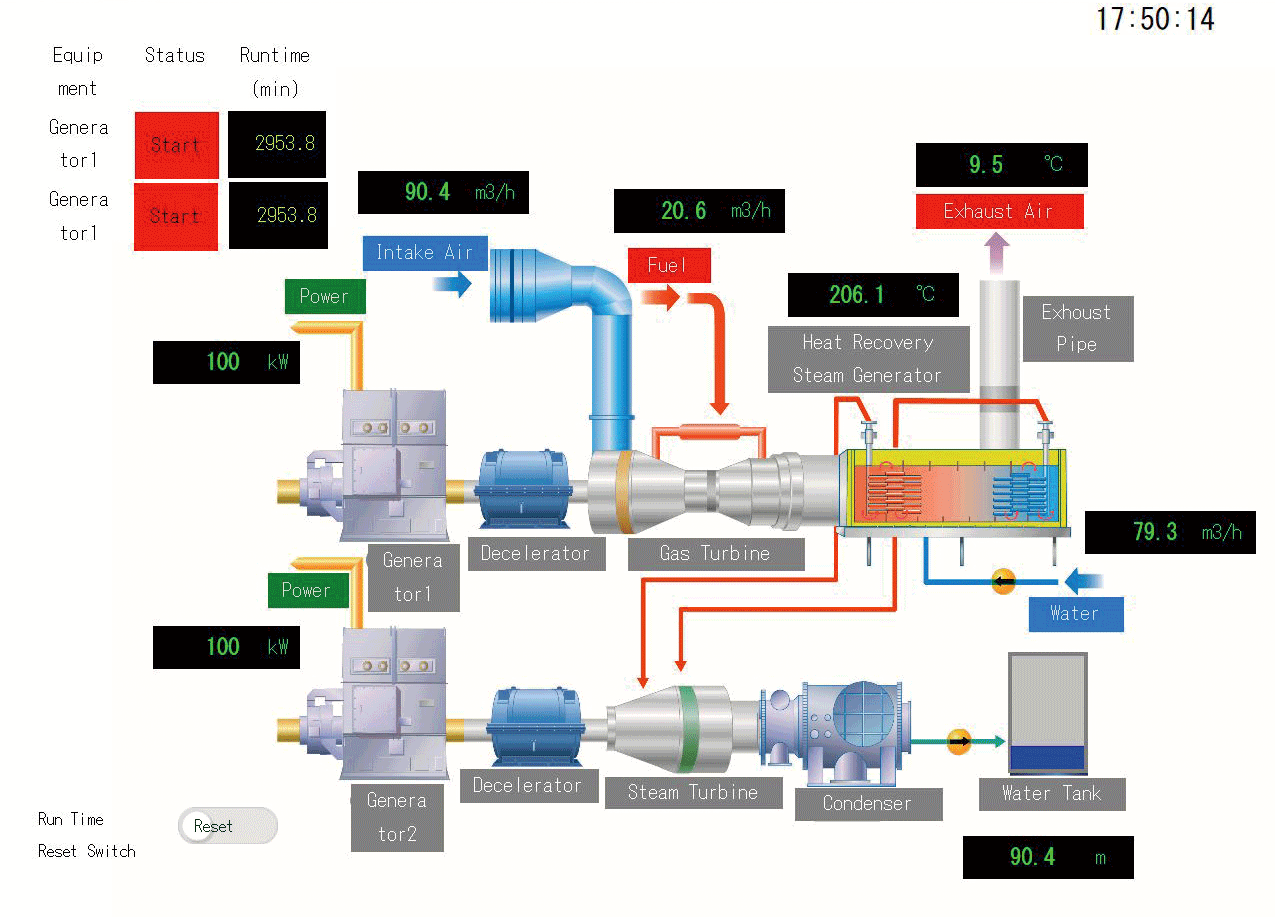
Process Operation Monitoring
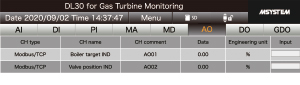
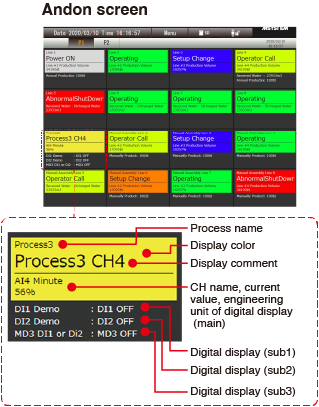
Andon*4 screen
The Andon Screen shows the status of equipment and production lines in real time.
This function displays the current status of production equipment with the Andon. The conditions of equipment, such as the operation, stop, workpiece shortage, setup change, or abnormal stop status, and physical quantities, including the temperature, flow rate, and liquid level, are input via remote I/O and displayed together with each item name and numerical value distinguished by color coding.
The arithmetic function performs time display and completes analysis operations.
The DL30-G has a function to integrate the contact ON or OFF time. You can use this to display the accumulated time of various states.
Furthermore, the DL30-G has versatile calculation functions, and it is possible to perform time measurement and various types of analysis, including the operating rate analysis of devices using the counter function.
*4. In manufacturing, the term andon (Japanese: originally meaning paper lantern; Japanese manufacturers began its quality-control usage.) refers to a system which notifies managerial, maintenance, and other workers of a quality or processing problem.
The alert can be activated manually by a worker using a pullcord or button or may be activated automatically by the production equipment itself.
The system may include a means to pause production so the issue can be corrected.
Some modern alert systems incorporate audio alarms, text, or other displays; stack lights are among the most commonly used.
Digital Data Display
The DL30-G can display up to 5 status levels by combining digital inputs or digital function register values . The display contents are display names, display colors, and numerical values (as main items), as well as three numerical values (sub-items 1 to 3).
Analog Data Display
The DL30-G can display 5 status levels of display colors, display comment, and numerical values (as main items) for the corresponding analog inputs, pulse inputs, and analog function register value range, as well as 3 numerical values (sub-items 1 to 3).
Gantt Chart Screen
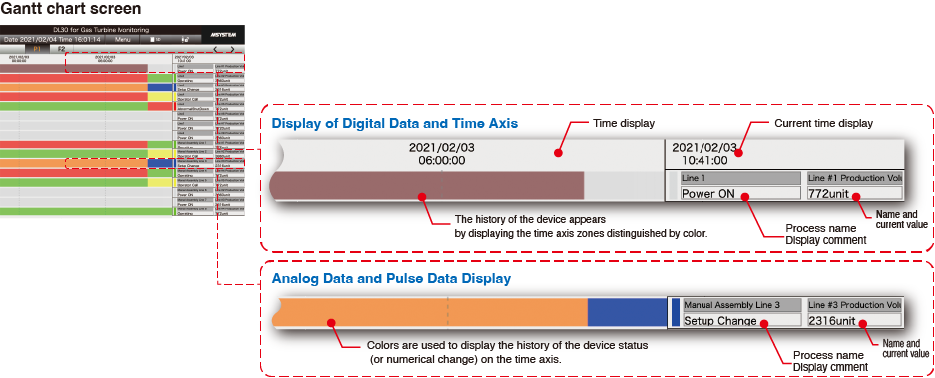
In the Gantt chart, the conditions of devices and the numerical value range are visually expressed by displaying the time axis in the Andon’s color. The DL30-G displays 12-hour data on a single screen. Furthermore, the DL30-G displays data for up to 48 hours in the past with the screen scrolled.
User-defined screen*5
You can create web screens freely by making full use of HTML, JavaScript image data (gif or jpg), CSS, etc. Furthermore, the current value of data measured by the DL30-G can be read as a JavaScript data file. DL30 Web Designer (user-defined screen creation software for the DL30-G) is available as a dedicated tool for easily creating user-defined screens. The created data is transferred from DL30 Web Designer to the DL30-G through a USB cable or over the Ethernet. The maximum capacity is 4 MB.
*5. The DL30 Web Designer is downloadable for free at our website.
The screen is an image only.